
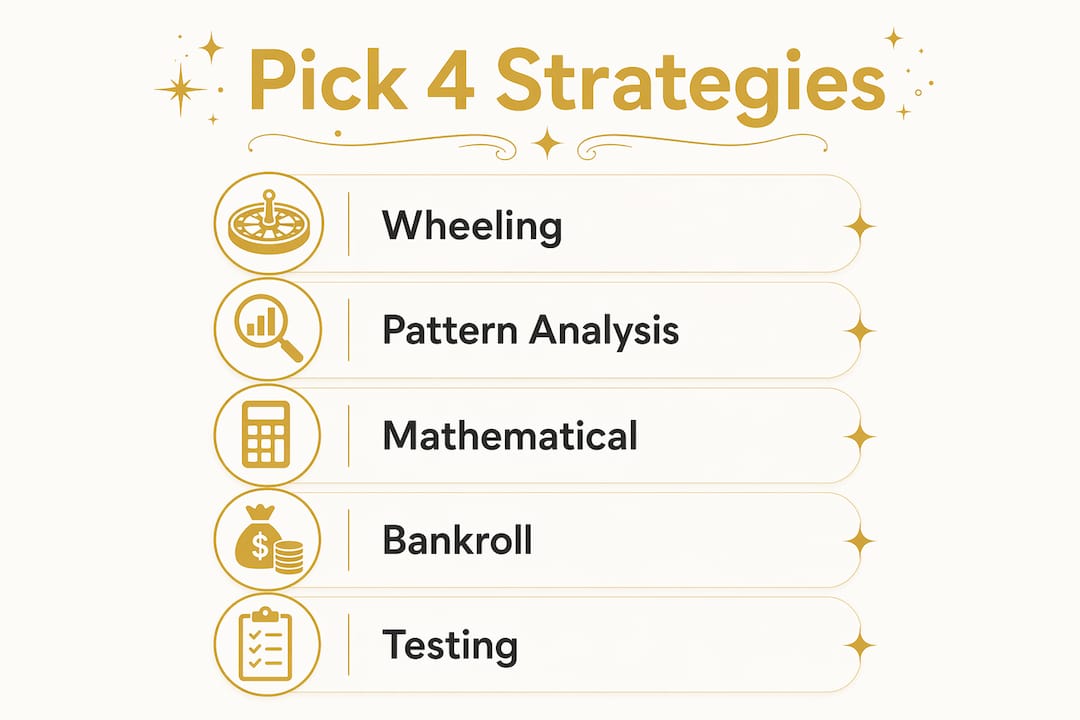
The four Pick 4 strategies worth your time are wheeling, pattern and trend analysis, mathematical selection methods (rundowns and grids), and bankroll management. No method changes the fundamental math: every draw is statistically independent, and straight odds are quite low, reflecting the long odds of hitting a specific four-digit combination. What these strategies do is give your play structure, discipline, and a way to test ideas without burning through your budget.
- Wheeling: covers more digit combinations across multiple tickets, increasing your chances of a box or partial hit
- Pattern and trend analysis: uses historical draw data to identify candidate digits by position, adding selection discipline
- Mathematical selection (rundowns/grids/filters): generates candidate combinations procedurally and shrinks them to an affordable set
- Bankroll management: defines how much you spend per session and when to stop, keeping play in the entertainment category
Table of Contents
- 1. How wheeling works and what it actually costs you
- 2. How to read historical draw data for pattern analysis
- 3. Mathematical selection methods: rundowns, grids, and sum filters
- 4. Bankroll management: straight, box, combo, and session limits
- 5. How to test a Pick 4 strategy without overspending
- 6. How Lottooracleapp can support your strategy workflow
- 7. The statistical reality: what odds actually mean for your play
- Key Takeaways
- The gap between what Pick 4 strategy promises and what it delivers
- Lotto Oracle: a smarter way to run your Pick 4 workflow
- Useful sources and Canadian draw archives
1. How wheeling works and what it actually costs you
Wheeling converts a pool of digits you've selected into multiple tickets that cover different arrangements of those digits. Instead of betting on one straight combination, you spread across box and partial-hit territory. The coverage vs. cost trade-off is the whole game with wheeling: more digits in your pool means more combinations and more tickets.
Here's a concrete example. Say you pick five digits: 2, 4, 6, 7, 9. A full wheel of all 4-digit arrangements from those five digits produces 120 unique permutations. At $1 per ticket, that implies a prohibitively high cost per draw. That's not a realistic session budget for most players.
A compact or abbreviated wheel solves this by covering a strategic subset of those arrangements. You might reduce your ticket count substantially while still guaranteeing a box win if your chosen digits appear in the draw. The trade-off is that you give up some coverage.
How to build a simple compact wheel:
- Choose several digits you believe are strong candidates (from pattern analysis or a rundown)
- Lock one "key digit" that must appear in every ticket
- Generate combinations that always include the key digit paired with different arrangements of the remaining digits
- Calculate total tickets and multiply by your ticket price to confirm the session cost fits your budget
Pro Tip: Locking a key digit in position 1 or position 4 cuts your ticket count significantly while keeping the wheel coherent. If your key digit hits, you're guaranteed at least a partial match across your entire wheel.
2. How to read historical draw data for pattern analysis
Pattern analysis starts with real data, not intuition. For Canadian players, the most reliable sources for Pick 4 draw histories are provincial lottery sites. OLG (Ontario Lottery and Gaming) publishes draw results and frequency tables for Ontario's Pick 4 game. Atlantic Lottery Corporation provides similar archives for Atlantic provinces. Check PlaySmart.ca for responsible-play context alongside strategy guidance.
Once you have data, the workflow is straightforward:
- Pull dozens of recent draws from the official archive
- Build a frequency table: count how often each digit (0–9) appears in each of the four positions
- Identify "hot" digits (appearing above average frequency) and "cold" digits (below average) per position
- Map your top hot digits per position as candidates
- Apply a basic filter: check that your candidate set spans a reasonable odd/even balance and a mid-range digit sum
Series numbers (consecutive digit sequences like 0123, 1234, 2345) appear in draw histories more often than players expect. Scanning your last 60 draws for series patterns takes five minutes and can surface a recurring structure worth testing.
Past draw frequencies tell you what has happened, not what will happen. Use positional heatmaps to build a shortlist of candidates, not to predict certainty. The structure they provide is the value, not the forecast.
One common mistake: limiting picks to calendar dates (days 1–31) leaves digits 0 and 3–9 underrepresented across positions. The full digit space is 0–9 per position. Date-based play systematically narrows your coverage.
3. Mathematical selection methods: rundowns, grids, and sum filters
These methods generate candidate combinations from a reference point rather than from historical frequency. They're procedural, repeatable, and easy to backtest.
The rundown method
A rundown starts with a reference draw (often the most recent result) and applies a fixed addition rule to each digit. A rundown adds fixed increments to each digit of a reference draw to generate multiple candidate combinations, producing a handful of possible picks from that starting point. Digits wrap around at 9 (so 9+2 = 1). You can also run a custom rule like +1/+3/+5/+7 for a different spread.
The grid (tic-tac-toe) method
Grid methods use a 4×4 matrix built from recent draws. Place four recent results as rows, then read horizontal, vertical, and diagonal lines as candidate combinations. A four-draw grid produces multiple candidate combos before filtering.

Sum-range filtering
Digit-sum distribution follows a bell curve. The mid-range sums (roughly 16–20) cover a dense zone of combinations. Filtering your candidate set to include combos within a mid-range digit sum removes outliers and keeps your ticket count manageable.
Before and after filtering:
- Raw rundown output: 5 combinations
- Raw grid output: 10 combinations
- Combined candidate pool: 15 combinations
- After sum filter (15–21 only): 8–10 combinations
- After odd/even balance filter (at least 2 of each): 5–7 tickets
That's a realistic session set at $5–$7 per draw.
4. Bankroll management: straight, box, combo, and session limits
Understanding bet types is the foundation of any bankroll plan. Here's how the main Pick 4 play types compare:
- Straight: exact order match; highest payout, lowest probability of hitting
- Box (unique digits): any order match; lower payout, but all-unique combos represent roughly 50.4% of all possible combinations
- Box (one pair): any order with one repeated digit; one-pair combos account for roughly 43.2% of all draws, making this a practical focus for box players
- Combo: plays all straight arrangements of your digits; covers more ground but costs proportionally more per ticket
Because buying more tickets raises cost without changing any single ticket's probability of winning straight, the math on combo plays deserves scrutiny before you commit.
Simple bankroll rules to follow:
- Set a fixed monthly budget before you play a single draw
- Cap each session at no more than 10% of your monthly budget
- Never play more simultaneous combinations than your session cap allows at $1 per ticket
- Define a stop-loss: if you lose three consecutive sessions, take a one-week break before resuming
A player with a modest monthly budget can plan sessions and draws to keep spending sustainable for testing purposes.
For responsible-gambling guidance and tools, BetsyScore offers practical resources on session limits and self-exclusion options relevant to Canadian players.

Responsible gambling callout: Pick 4 is entertainment. If spending feels stressful or you're chasing losses, that's the signal to stop. Set your budget before you play, not after.
5. How to test a Pick 4 strategy without overspending
Testing a strategy properly takes patience and a logging habit. Short-term results are noisy by design; small samples tell you very little about a method's long-term behavior. Box plays give you more feedback per draw, which is why they're better for testing phases.
Step-by-step test plan:
- Choose one strategy (rundown, wheeling, or pattern-based selection) and stick with it for the test period
- Set a fixed test budget (example: $80 over 40 draws at $2 per draw)
- Define your baseline: compare your method against a random quick-pick over the same draws
- Log every draw using the template below
- Evaluate after 40 draws using simple metrics
- Decide: continue, adjust the filter, or switch methods
Logging template (one row per draw):
- Date of draw
- Numbers played and play type (straight/box/combo)
- Cost per draw
- Prize won (if any)
- Net result (prize minus cost)
- Running total (cumulative net)
Evaluation metrics to track:
- Hit rate: number of draws with any prize divided by total draws played
- Net per 40 draws: total prizes minus total cost
- Longest losing streak: consecutive draws with zero prize
- Comparison to baseline: does your method outperform random selection over the same period?
Backtesting and logging are how you separate a method that feels good from one that actually performs differently from random. Expect variance. A 40-draw sample is a starting point, not a verdict.
6. How Lottooracleapp can support your strategy workflow
Lotto Oracle brings together several of the tools described above in a single subscription platform. Rather than building frequency tables manually in a spreadsheet, the app handles positional heatmaps, trend tracking, and rundown generation in a guided workflow.
Key features relevant to Pick 4 play:
- Positional heatmaps showing hot and cold digits per draw position
- Rundown and grid helpers that generate candidate combinations from a reference draw
- Wheeling assistance to convert a digit pool into a structured ticket set
- Number logging and export tools for tracking session results over time
- Numerology and pattern overlays for players who want an additional selection layer
Example workflow inside the app:
- Import your recent draw history (or enter the last 30 results manually)
- Run the positional heatmap to identify top candidates per position
- Use the rundown helper with your chosen reference draw to generate candidates
- Apply the sum filter to trim the candidate set
- Run the wheeling tool to structure your final tickets
- Export or log your plays before the draw
Lotto Oracle does not sell lottery tickets and does not guarantee wins. It's a guidance and entertainment platform. Think of it as the analytical layer that sits between your raw draw data and your final ticket decisions.
7. The statistical reality: what odds actually mean for your play
The math here is fixed and worth stating plainly. There are 10,000 possible straight combinations in Pick 4 (0000 through 9999), so your straight odds on any single ticket are 1 in 10,000. Box odds improve depending on digit arrangement: a 4-unique-digit combo has 24 arrangements, so a $1 box play on it covers 24 of those 10,000 outcomes.
Every draw is statistically independent. A digit that appeared in yesterday's draw has exactly the same probability of appearing today as any other digit. Pattern tools don't change this. What they do is give you a structured, repeatable way to choose which combinations to play, which is more useful than random selection for tracking and testing purposes.
No strategy converts Pick 4 into a positive expected-value game. The house edge is built into the payout structure. Treat every dollar spent as the cost of entertainment, and treat any prize as a bonus.
One-pair combinations account for roughly 43.2% of all draws. That frequency makes box plays on one-pair combos a practical focus for players who want more regular, smaller feedback during a testing period.
If you ever feel your play is becoming compulsive or financially harmful, the Responsible Gambling resources at BetsyScore and the Ontario Problem Gambling Helpline (1-888-230-3505) are available to Canadian players.
This article is general information, not financial or gambling advice. Confirm current rules and odds with your provincial lottery authority before playing.
Key Takeaways
The most effective Pick 4 approach combines one candidate-generation method (rundown or pattern analysis) with disciplined bankroll rules and consistent logging across at least 40 draws.
| Point | Details |
|---|---|
| Straight odds are fixed | Every Pick 4 straight ticket faces 1-in-10,000 odds; no strategy changes this figure. |
| Box plays give more feedback; one-pair combos appear frequently, making box play practical for testing phases. | |
| Filters reduce ticket cost | Applying a sum-range filter (digits summing to 15–21) can cut a raw candidate set from 15 to 5–7 tickets. |
| Log every session | Track date, numbers, play type, cost, and prize to calculate hit rate and net per 40 draws. |
| Lotto Oracle supports the workflow | Lottooracleapp provides positional heatmaps, rundown helpers, and logging tools to implement these strategies in one place. |
The gap between what Pick 4 strategy promises and what it delivers
Most Pick 4 strategy content oversells the idea that pattern analysis or mathematical methods give you an edge over the house. They don't, and pretending otherwise does readers a disservice. What these methods genuinely offer is something more modest and, honestly, more useful: a framework for making consistent, traceable decisions instead of impulsive ones.
Running small, logged tests over 40 draws taught me something that no strategy guide states clearly enough: the value of a method isn't whether it beats random selection in a given month. It's whether it keeps you from spending more than you planned, chasing losses, or making decisions based on emotion after a losing streak. The logging habit alone is worth more than any specific number-selection technique.
Use the strategies in this guide as a structure for play, not a system for profit. Keep your budget fixed, your records honest, and your expectations grounded. That's what responsible, enjoyable Pick 4 play actually looks like.
Lotto Oracle: a smarter way to run your Pick 4 workflow
If building frequency tables in a spreadsheet and running rundowns by hand sounds like more work than fun, Lottooracleapp is worth a look. The app puts positional heatmaps, rundown generators, wheeling tools, and session logging in one place, so you spend less time on setup and more time evaluating actual results.
The practical starting point: enter your last 30 draws, run the heatmap, generate a rundown from the most recent result, apply the sum filter, and export your final ticket set. The whole workflow takes under ten minutes. Lottooracleapp does not sell lottery tickets and makes no guarantee of winning. It's an entertainment and guidance tool designed to make structured play more accessible.
Try Lotto Oracle and run your first demo workflow using recent Canadian draw results before committing to a full session budget.
Useful sources and Canadian draw archives
These sources support the strategies and examples in this guide. Use them to pull official draw histories, frequency tables, and responsible-play guidance.
Official Canadian draw data:
- OLG (Ontario Lottery and Gaming): olg.ca — publishes Pick 4 draw results and frequency tables for Ontario players; results are searchable by date
- Atlantic Lottery Corporation: alc.ca — draw archives for Atlantic provinces; downloadable result histories available for some games
- PlaySmart.ca: daily lottery game strategies and responsible-play context from OLG's player-education arm
Strategy and analysis references:
- DrawAnalytics Lottery Blog: detailed breakdown of Pick 4 odds, combo-type distributions, and sum-range filtering with sourced data
- CTV News (lottery strategy coverage): expert commentary on statistical independence and realistic expectations for Canadian lottery players
Responsible gambling:
- BetsyScore Responsible Gambling: practical session-limit tools and self-exclusion guidance for Canadian players
- Ontario Problem Gambling Helpline: 1-888-230-3505 (available 24/7)
How to use these inside Lotto Oracle: Import draw histories from OLG or ALC into the app's logging tool, then run the heatmap and rundown features against your imported data. The app's export function lets you save candidate sets back to a spreadsheet for further backtesting if you prefer working across both tools.