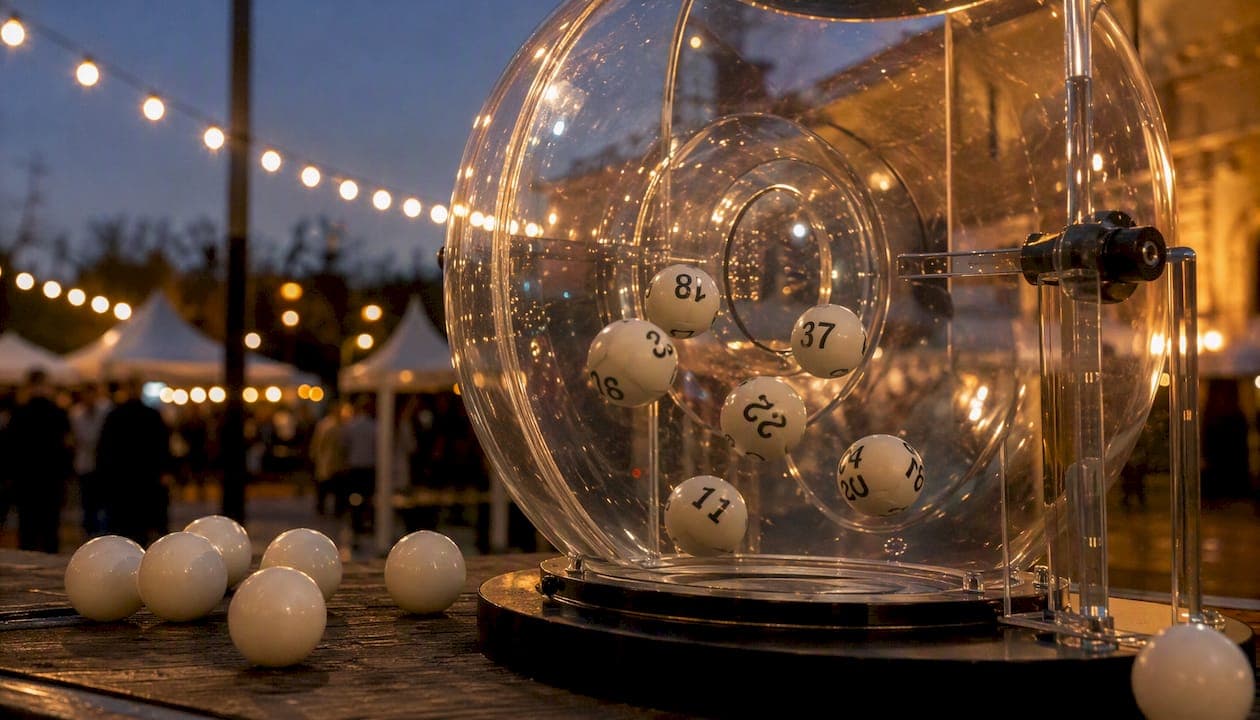
For Canadian lotteries, live frequency tables live at three reliable addresses: the OLG results page, PlayNow (for British Columbia players), and frequency tools built into platforms like Lottooracleapp. Each table tells you how many times each number has appeared across a defined draw range. What it cannot tell you is which number will come up next. Every draw is statistically independent, and past frequency has zero effect on future odds.
When you open any frequency table, scan for these signals before trusting the data:
- Last-updated timestamp — confirms the table reflects the most recent official draw
- Draw range — the start date and end date of draws counted
- Times drawn column — the raw count for each main number
- Counting rule note — whether bonus or extra numbers are tracked separately from main numbers
Key Takeaways
Frequency tables describe past draws accurately; they do not change the fixed odds of any future draw or predict which numbers will appear next.
| Point | Details |
|---|---|
| Frequency describes history | Past draw counts have no effect on future odds; each draw is statistically independent. |
| Check the metadata first | Always verify the last-updated timestamp, draw range, and whether bonus numbers are counted separately. |
| Use it to avoid popular picks | Contrarian selections can reduce expected prize splitting when a ticket wins, per draw-independence research. |
| Window size changes the picture | Switching from a 365-draw window to a 30-draw window will reclassify which numbers are hot or cold. |
| Lottooracleapp integrates it all | Lottooracleapp combines configurable frequency windows, exportable snapshots, and personalized picks in one platform. |
Table of Contents
- What a number-frequency table looks like
- How frequency counts are actually calculated
- How to use frequency data without fooling yourself
- Where to find frequency data for other Canadian lotteries
- How lottery draws work and what that means for odds
- How frequency data and probability actually connect
- My honest take on frequency tables
- Lottooracleapp gives you frequency tools built for Canadian players
- Sources
What a number-frequency table looks like
A trustworthy frequency table has six columns. Understanding each one lets you pull exactly the data you need.
- Number — the ball value (1 through 49 for Lotto 6/49)
- Times drawn — total appearances within the draw range
- Last drawn date — the most recent draw in which that number appeared
- Draws ago / days since — how many draws or calendar days have passed since the last appearance
- Hot/cold tag — a label applied when the number's frequency sits above or below a threshold (not all tables include this)
- Bonus/extra flag — indicates whether the count includes bonus-ball draws or main-number draws only
Below is a sample layout for Lotto 6/49, covering a hypothetical 200-draw window:
Sample only — not sourced from official draw records. Always verify against OLG or your provincial lottery corporation.
The metadata above the table matters as much as the numbers inside it. Look for the total draws counted, the exact draw-range dates, and an explicit note on whether bonus numbers are pooled with main numbers or tracked in a separate column.
How frequency counts are actually calculated
Counting rules determine what the numbers in that table actually mean, and they vary more than most players realize.
Main vs. bonus numbers. In Lotto 6/49, each draw produces six main numbers plus one bonus number. A table that counts all seven together will inflate frequency for numbers that frequently land in the bonus position. Reputable tables separate the two pools.
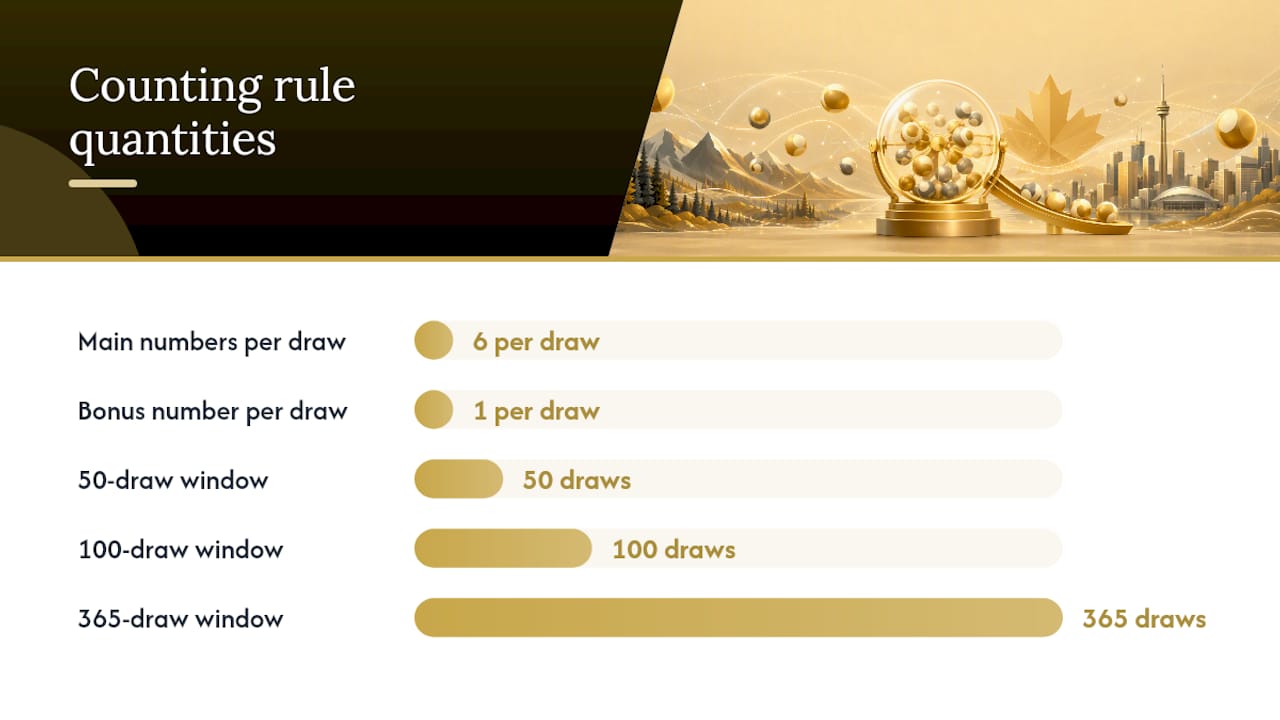
Windowing. A full-history count stretches back to the game's first draw. A windowed count covers only the last N draws (50, 100, or 365 draws are common). As Lottery Atlas explains, changing the window changes which numbers are flagged as hot or cold. A number that looks cold over 365 draws may look neutral over 50.
Update cadence. Official provincial pages typically update after each draw. Third-party aggregators may run nightly or weekly batch updates. Always check the last-updated timestamp before drawing conclusions from a short-window analysis.
Edge cases to watch for:
- Corrected or voided draws — a retroactive correction changes historical counts
- Duplicate draw numbers in older records
- Game-rule changes (Lotto 6/49 changed its structure in 2022) that split the history into two distinct eras
- Tables that do not document their own counting rules — treat these with skepticism
A methodology using configurable windows and standard-deviation thresholds (such as 30, 60, 90, 180, and 365-day windows flagging numbers beyond 1.5 standard deviations) gives a far more honest picture than a simple rank-order count.
How to use frequency data without fooling yourself
Past frequency is descriptive, not predictive. Each Lotto 6/49 draw is a fresh, independent event. A number that appeared 30 times in the last 200 draws has exactly the same probability of appearing in draw 201 as a number that appeared 15 times.
Hot and cold labels describe past frequency inside a chosen window and do not make a number more or less likely next draw. Short windows produce larger variance by definition, which means a "hot" number in a 30-draw window may simply be riding normal statistical noise.
Common mistakes:
- Treating an overdue number as "due" — this is the gambler's fallacy, and it has no statistical basis
- Over-weighting a very short window (fewer than 50 draws) where variance is high
- Assuming a hot streak will continue
Practical uses that actually hold up:
- Avoid birthday-heavy combinations (numbers 1–31 are disproportionately popular among players). Contrarian picks can slightly reduce expected prize splitting when your ticket wins.
- Use frequency as a tiebreaker between two otherwise equivalent Quick Pick options, not as a primary selection system.
- For digit games like Pick 3 or Pick 4, positional frequency matters — the frequency of a digit in position 1 is tracked separately from position 2. This is a different analysis from lotto-style aggregate counts.
Pro Tip: When a published frequency table shows one number appearing vastly more or less often than all others across thousands of draws, that's worth flagging. It could indicate a data-entry error, a retroactive rule change, or, rarely, a mechanical bias worth reporting to the lottery corporation.
For a deeper look at lottery probability basics and how frequency fits into the broader math, the Lottooracleapp blog covers the fundamentals clearly.
Where to find frequency data for other Canadian lotteries
Official sources are the primary trust signal. Provincial lottery corporations publish draw results and, in many cases, frequency summaries directly:
- OLG (Ontario Lottery and Gaming) — results and draw history for Lotto 6/49, Lotto Max, and Ontario-specific games
- Loto-Québec — French and English draw records for Québec games
- BCLC / PlayNow — British Columbia draw history and some frequency tools
- Atlantic Lottery Corporation — results for Atlantic Canada games
Reputable third-party aggregators compile draw history across multiple games and often offer frequency tools that official pages do not. Look for sites that display their draw-range dates, state their counting rules, and separate main from bonus numbers. LottoFrequency, for example, updates after every official draw and offers configurable windows alongside exportable CSV files.
When evaluating any source, check three things: the last-updated timestamp, the draw range covered, and whether bonus numbers are counted separately. A site that cannot answer all three clearly is not a reliable source for lottery number frequency analysis.
How lottery draws work and what that means for odds
Canadian lottery draws use certified random number generators or physical ball-draw machines audited by provincial regulators. Each draw is conducted independently, with no mechanical memory of previous results. The odds for Lotto 6/49 are fixed at 1 in 13,983,816 for the jackpot, regardless of which numbers appeared last week.

This matters for frequency analysis because the draw mechanism itself produces no patterns. Any clustering you see in a frequency table is the expected result of random variation, not a signal that the machine favors certain numbers. Over a large enough sample, every number in a fair game will converge toward the same expected frequency.
How frequency data and probability actually connect
Frequency data is a sample of past outcomes from a fixed probability distribution. In a fair 6/49 draw, each number has a theoretical probability of being drawn in any given draw. Over thousands of draws, observed frequencies should approximate that theoretical rate, but short-run deviations are normal and expected.
A chi-square test can check whether observed frequencies deviate significantly from expected frequencies across all numbers. If a game's draw history passes that test, the distribution is consistent with randomness. If it fails, that's a reason to investigate the data or the draw process, not a reason to bet on specific numbers.
Frequency data, then, is most useful as a fairness check and a tool for avoiding popular combinations. It is not a forecasting system.
My honest take on frequency tables
Most players either ignore frequency data entirely or treat it as a crystal ball. Both approaches miss the point. I use frequency tables the way a card player uses a count: as one input that slightly improves a decision, not as a guarantee.
The most practical use I've found is avoiding popular combinations. Birthdays, neat sequences (1-2-3-4-5-6), and last week's winning numbers are all disproportionately popular picks. Choosing contrarian numbers from cold or mid-range ranges does not improve your odds of winning, but it does reduce the chance of splitting a jackpot if you do win.
My personal rules: fixed budget per draw, never more than a handful of tickets, and frequency data used only for combination selection, never as a reason to buy more tickets. The Canadian player's guide to hot numbers on the Lottooracleapp blog covers this approach in more detail.
Lottooracleapp gives you frequency tools built for Canadian players
Public frequency tables are a starting point. Lottooracleapp goes further by combining historical draw analysis with configurable windows, personalized number suggestions, and exportable frequency snapshots, all in one place.
Every frequency view in Lottooracleapp displays the draw range covered, the last-updated timestamp, and a clear note on whether bonus numbers are counted separately. You get the trust signals that matter, without hunting across multiple provincial pages. The platform layers in numerology and zodiac-based insights for players who want a themed angle on top of the statistical picture.
For players who want to move beyond raw counts and into pattern tracking, trend analysis, and personalized picks, Lotto Oracle offers a free demo to get started.
Sources
Official provincial sources:
- Hot and Cold Lottery Numbers — Do They Work?
- Hot, Cold, and Due Numbers: What They Really Mean (And Whether They Matter) — Lottery Atlas
- Hot and Cold Lottery Numbers Explained: What They Mean and How to Use Them | DrawAnalytics Lottery Blog
- Hot and Cold Lottery Numbers Explained (Do They Work?)
Reputable third-party tools:
What to check before downloading any file: