
Playing the same numbers every week, or chasing last draw's results, does not improve your per-ticket odds. Every combination in a fair draw carries identical probability, determined entirely by combinatorics, not history. The Law of Truly Large Numbers explains why repeats appear anyway: with thousands of draws across dozens of lotteries, coincidences become statistically inevitable. What a repeat number lottery strategy can do is help you avoid popular picks, which lowers your chance of splitting a jackpot. That is the real edge, and it is worth understanding precisely.
- Verdict: Per-ticket jackpot probability is fixed by the combinatorics formula for your game, not by which numbers you choose.
- Action: Use historical draw data to identify crowded picks, then shift toward less-common combinations to protect your share of any prize you do win.
- Evidence anchors: The binomial choose formula C(P, W), Lotto 6/49 parameters (P=49, W=6), and documented full-draw repetitions all point the same direction.
Key Takeaways
Repeating lottery numbers does not change your per-ticket odds, but it can change your split-prize exposure, and that distinction is worth building a strategy around.
| Point | Details |
|---|---|
| Repeats don't change odds | Every combination carries the same 1-in-C(P,W) probability, regardless of draw history. |
| Repeats are statistically expected | The Law of Truly Large Numbers means short-gap repeats and even full-draw repetitions occur in legitimate random systems. |
| Testing is straightforward | A Monte Carlo simulation on official draw archives, with multiple-comparison correction, is the honest way to evaluate any strategy. |
| Crowd-avoidance is the real lever | Avoiding date-based picks (numbers ≤ 31) lowers split-prize risk without touching your underlying win probability. |
| Lottooracleapp automates the workflow | The app handles repeat-interval reports, pattern overlays, and number generation so you can test hypotheses without manual scripting. |
Table of Contents
- How Canadian lottery draws work and why the math matters
- Why repeated numbers and streaks show up in random draws
- Does playing the same numbers every draw actually change your odds?
- How to test a repeat-number strategy with real data
- Practical strategies informed by repeat-number analysis
- Costs, expected value, and responsible play for Canadian players
- Your quick checklist for testing a repeat-number strategy
- What the data actually tells us about chasing repeats
- Lottooracleapp makes repeat-interval testing faster
- Sources
How Canadian lottery draws work and why the math matters
Every provincial lottery in Canada uses a physical or certified random-number draw. Balls are drawn without replacement inside a single draw, meaning once ball 23 comes out, it cannot appear again in that same draw. Across draws, however, each event is statistically independent: what happened Tuesday has zero mechanical effect on Saturday's outcome.
Three parameters define the odds for any game:
- P — the pool size (total numbered balls in the machine)
- W — the winning balls drawn per game
- T — the numbers you select on your ticket (usually equal to W)
For Lotto 6/49, Canada's flagship national game, P=49, W=6, and T=6. The standard combinatorics formula for matching all six numbers is:
Pr[jackpot] = 1 / C(49, 6) = 1 / 13,983,816
That denominator, roughly 14 million, is the total number of distinct six-number combinations from 49 balls. Every single combination, whether it's 1-2-3-4-5-6 or 7-14-22-31-38-45, has exactly the same 1-in-13,983,816 chance. Order does not matter because the draw is unordered; the formula counts combinations, not permutations.
For Lotto Max odds in detail, the larger pool and extra ball push the denominator to roughly 33 million, which is why jackpots grow larger before rolling over. The key point: both games treat every ticket identically. No ticket is "due," and none is "hot."
Pro Tip: If you want to check the lottery probability basics behind these formulas before running your own tests, the combinatorics are the same whether you play 6/49 or any other pick-style game.
Why repeated numbers and streaks show up in random draws
Randomness clusters. That is not a flaw in the draw system; it is a mathematical property of independent random events. Flip a fair coin 100 times and you will almost certainly see runs of five or six heads in a row. Lottery draws behave the same way.
The Law of Truly Large Numbers formalizes this: when the number of opportunities is enormous, even very unlikely events become expected to occur somewhere. Canada alone runs hundreds of draws per year. Globally, thousands of lotteries have operated for decades. Under those conditions, seeing a number repeat in consecutive draws, or even seeing an entire combination repeat, is not evidence of manipulation. It is probability working exactly as advertised.
A concrete historical example: in Bulgaria's national 6/49 draw in 2009, the exact same six numbers appeared in two consecutive draws. Authorities investigated and confirmed the draw was legitimate. With roughly 14 million possible combinations and thousands of draws worldwide each year, a full repeat somewhere in lottery history is not just possible; it is expected. That event is useful as an illustration of probability, not as a reason to play those numbers again.
Repeat-interval data from Powerball archives reinforces this picture. Analysis of historical Powerball draws shows that individual numbers commonly return within just a few draws, and adjacent-draw repeats occur regularly. The most frequent repeat interval in that dataset is small, confirming that short-gap returns are a normal feature of random sequences, not a signal.
- Clumping is a property of randomness, not a pattern to exploit.
- The gambler's fallacy runs in both directions: a number that just appeared is neither "due to rest" nor "on a hot streak."
- Human perception is wired to find patterns; Keno and other number games show the same perceptual bias at work.
Does playing the same numbers every draw actually change your odds?
No. Per-ticket probability is unchanged whether you play the same combination every week for a year or pick a fresh random set each time. The combinatorics formula does not care about your selection history.
Here is why that is not obvious: people intuitively feel that playing the same numbers repeatedly "covers" more ground over time. It does not. Each draw is independent. Playing 1-7-14-22-31-45 on Saturday does not make those numbers more likely to appear next Saturday. You are buying one ticket with a 1-in-13,983,816 chance, exactly as you would with any other combination.
For a larger-scale illustration, consider the historical Powerball format (5 balls from 59, plus 1 Powerball from 39). The total combinations equal C(59,5) × 39, which works out to 1 in 195,249,000. Playing the same ticket for 195 million consecutive draws would give you an expected one jackpot win, but no guarantee. Playing 195 million different combinations in a single draw would guarantee a win. The distinction matters: repetition across draws does not accumulate probability.
| Game | Format | Per-ticket jackpot odds |
|---|---|---|
| Lotto 6/49 | 6 from 49 | 1 in 13,983,816 |
| Powerball (historical 5/59+1/39) | 5 from 59 + 1 from 39 | 1 in 195,249,000 |
Where repeating numbers does matter: split prizes. When many players use the same combination, a jackpot win means sharing. Date-based picks (all numbers 31 or below, because months and days cap at 31) are disproportionately popular. Choosing numbers above 31 does not raise your chance of winning, but it meaningfully lowers your chance of splitting the prize if you do win. That is the one practical lever repeat-number analysis gives you.
- Per-ticket odds: identical regardless of whether you repeat picks.
- Cumulative probability across draws: does not compound the way players expect.
- Split-prize risk: real and addressable by avoiding popular combinations.
How to test a repeat-number strategy with real data
You can run a reproducible test on any Canadian game in an afternoon. The goal is not to find a magic pattern; it is to confirm, with your own data, that no persistent dependency exists and to measure split-prize exposure for common picks. Statistical tests applied to real lottery archives consistently return results consistent with randomness, but running the test yourself is more convincing than reading about it.

Step 1: Get the data. Download historical draw results from the official OLG website (Ontario Lottery and Gaming) or Loto-Québec for Canadian games. International archives like statlotto.com provide downloadable Powerball and Mega Millions histories for comparison.
Step 2: Clean and structure. Load draws into a spreadsheet or Python/R script. Each row is one draw; columns are Ball 1 through Ball 6 (sorted ascending). Add a draw-date column.
Step 3: Define your hypothesis. A testable hypothesis: "Numbers drawn in draw N appear more often in draw N+1 than chance predicts." Null hypothesis: repeat frequency matches the expected rate under independence.
Step 4: Run a simple Monte Carlo simulation.
for trial in 1..10,000:
    simulate 500 draws from uniform random(1..49), pick 6 without replacement
    count how many numbers from draw[i] appear in draw[i+1]
    record repeat count per trial
compare observed repeat counts from real data to simulated distribution
Use 10,000 trials for stable estimates.
Step 5: Apply multiple-comparison correction. Testing many hypotheses (hot numbers, cold numbers, adjacent repeats, gap patterns) inflates false-positive rates. Use a Bonferroni correction or Benjamini-Hochberg procedure to avoid spuriously "discovering" patterns that are noise. Analysts studying lottery patterns specifically flag this risk.
Step 6: Evaluate metrics. Track hit counts (how often your strategy would have matched numbers), expected value per ticket, and split-prize incidence for popular vs. unpopular combinations.
Visualizations worth producing: a histogram of repeat-interval lengths (how many draws between a number's appearances), a distribution of hit counts across simulation trials, and an EV curve as sample size grows.
Pro Tip: AI-assisted lottery tools can automate the data-pull and simulation loop, but understanding the steps above lets you verify any tool's output rather than taking it on faith.
Practical strategies informed by repeat-number analysis
Repeat analysis is most useful for two things: building personal discipline around your picks, and avoiding the crowd. It does not change the raw probability on your ticket.
- Fix your picks or randomize fully, but commit to one approach. Switching between strategies mid-stream makes it impossible to evaluate results honestly. If you play fixed numbers, track them consistently for at least 100 draws before drawing conclusions.
- Avoid date-based numbers. Any combination drawn entirely from 1–31 overlaps heavily with birthdays and anniversaries. Millions of players use them. If you win, you are far more likely to split.
- Shift at least two numbers above 31. This alone reduces your overlap with the most popular tickets without changing your odds of winning.
- Use lottery wheel systems only in smaller games. Wheels guarantee coverage of certain sub-combinations, but in a 6/49 game the cost of full coverage is prohibitive. They make more sense in Pick 4 or smaller-pool formats.
- Track repeat intervals for your game. Knowing that a given number returned within five draws 30% of the time in historical data does not make it more likely next draw, but it calibrates your expectations and prevents over-reading short streaks.
- Limit ticket duplication. Buying five identical tickets gives you five times the cost but the same probability as one ticket, since each ticket is an independent event. Spread budget across distinct combinations instead.
Pro Tip: The behavioral reasons players choose sentimental or repeated numbers are well-documented. Recognizing your own tendencies is the first step to making picks that serve your EV rather than your emotions.
A quick split-prize illustration: if 10,000 tickets in a draw share the same combination and the jackpot is $10 million, each winner collects $1,000. A less-popular combination with zero other holders pays the full $10 million. Your odds of winning were identical in both cases.

Costs, expected value, and responsible play for Canadian players
Lotteries are negative expected-value (EV) by design. The house keeps a portion of ticket revenue before prizes are paid. Repeat-number choices do not change that baseline.
A simple EV calculation for a Lotto 6/49 ticket (approximate, using public prize structures):
- Ticket cost: a few Canadian dollars per ticket
- Jackpot probability: 1 in 13,983,816
- Jackpot value (hypothetical): several million dollars
- Jackpot contribution to EV: jackpot value divided by the large number of combinations yields a small expected return
- Smaller prizes add a modest fraction of the ticket price in aggregate expected value
- Total expected return per ticket: less than the ticket price, indicating a negative expected value
That is a return of roughly 25–32 cents on the dollar before taxes and before accounting for jackpot splits. No selection strategy changes the prize structure or the pool's take-out rate. Playing "hot" numbers, repeating last week's draw, or using numerological picks all produce the same negative EV.
Canadian players should note that lottery prizes in Canada are generally not subject to federal income tax when won by individuals playing for personal enjoyment, but rules can vary by province and by how winnings are invested afterward. Check your provincial lottery corporation's official site (OLG for Ontario, Loto-Québec for Quebec, BCLC for British Columbia) for current claiming procedures.
Responsible gambling resources available to Canadian players include the Responsible Gambling Council (rgco.org) and provincial self-exclusion programs offered through each lottery corporation. Setting a fixed monthly lottery budget and treating tickets as entertainment spending, not investment, is the most straightforward way to keep play sustainable.
This article provides general information only, not financial or legal advice. Confirm current rules with your provincial lottery authority or a qualified professional.
Your quick checklist for testing a repeat-number strategy
Use this before committing to any number selection system:
- Choose your game and download its draw history from the official provincial lottery site or a verified archive.
- Run a small simulation (at least 1,000 trials) comparing your strategy's hit rate to random selection.
- Check historical repeat intervals for your target numbers: how many draws typically pass before each number reappears?
- Estimate split-prize risk by checking whether your combination is date-heavy (all numbers ≤ 31) or overlaps with common patterns.
- Set a budget and stop rules before you start: decide your monthly spend limit and how many draws you will track before evaluating results.
- Correct for multiple comparisons if you test more than one hypothesis on the same dataset.
- For automated repeat-interval tracking and simulation, Lottooracleapp can run these steps without manual scripting.
What the data actually tells us about chasing repeats
The evidence is consistent enough that I will say it plainly: repeat-number strategies are a behavioral tool, not a probability tool. The math does not budge. Every combination in a fair draw has the same chance, and no amount of historical analysis changes that denominator.
What does shift is how you manage the human side of lottery play. Tracking repeat intervals forces you to engage with actual data rather than gut feeling. Running even a simple Monte Carlo test builds calibration: you stop expecting patterns that are not there and start noticing the one thing you can control, which is how much overlap your picks have with other players. Crowd-avoidance is not glamorous, but it is the only lever the combinatorics leave open.
The astrology and numerology traditions that inform tools like Lottooracleapp are not in conflict with this view. They serve a different function: structuring your picks in a personally meaningful way, which makes consistent play easier to sustain. Discipline and consistency matter more than most players admit, because the alternative is abandoning a strategy after three bad draws and never accumulating enough data to evaluate it honestly. Whether your picks come from a birth chart, a frequency table, or a random generator, the discipline to track them rigorously is what separates a testable hypothesis from wishful thinking.
Run the test. Share what you find.
Lottooracleapp makes repeat-interval testing faster
If the simulation steps above sound like a weekend project, Lottooracleapp compresses them into minutes. The app pulls historical draw data, generates repeat-interval reports, and runs pattern analysis across Canadian and international games without requiring any scripting on your end.
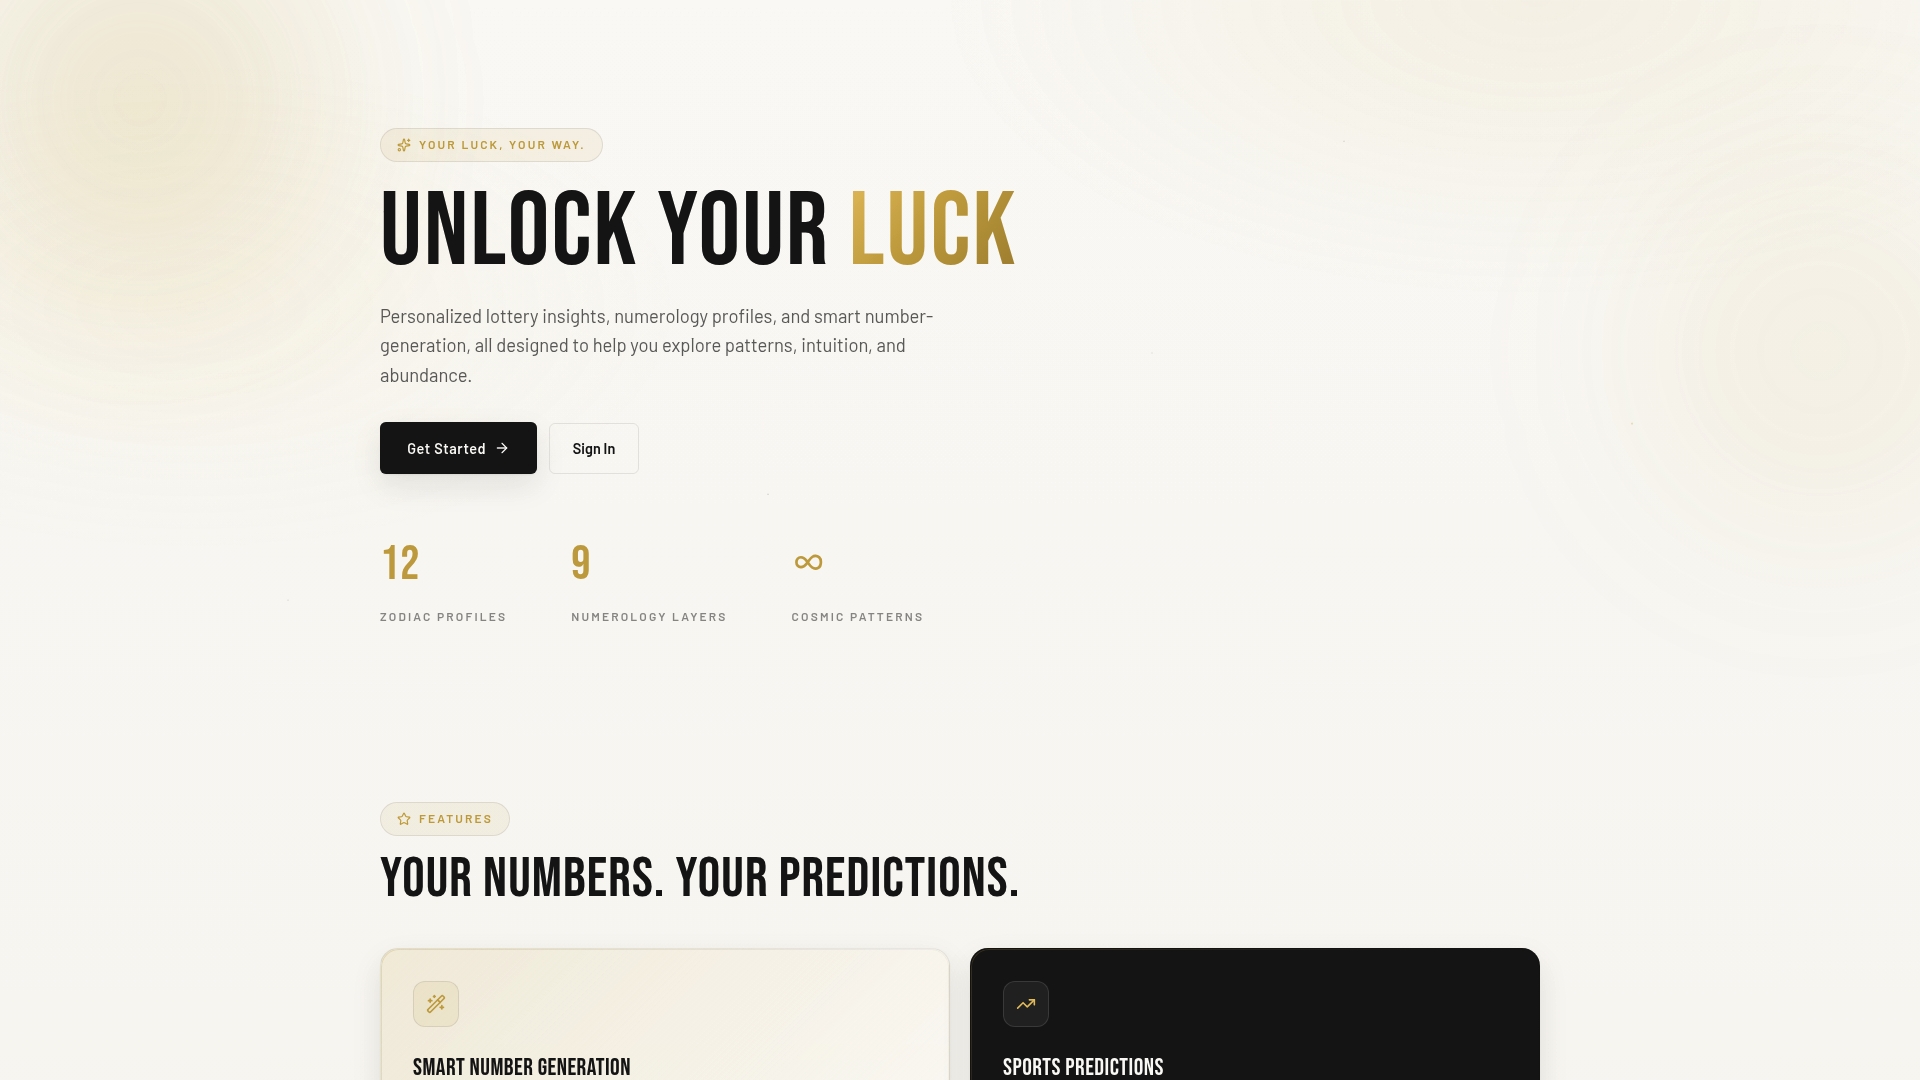
Four features are directly relevant to the workflow described in this article:
Trend and repeat tracking shows you how often each number has returned within short intervals, giving you the repeat-interval histogram without building it manually.
Numerology and pattern overlays let you cross-reference frequency data with zodiac or numerological profiles, so your picks reflect both the statistical picture and your personal system.
Unlimited number generation means you can produce dozens of candidate combinations and filter out the date-heavy ones before committing.
Simulation-ready outputs let you export your candidate picks and compare them against historical hit rates, which is the core of the Monte Carlo approach described above.
Try Lottooracleapp to run your first repeat-interval report and see which of your regular picks overlap most with the crowd.
Sources
These are the primary references and data sources for reproducing the tests described above:
- Lottery oddities may not be odd at all
- Lottery mathematics
- Odds of Winning the Lottery Using the Same Numbers Repeatedly Better/Worse?