
Pair-frequency analysis tracks how often two specific numbers land in the same draw across a game's history, using metrics like hits, skips, and streaks. The practical takeaway is simple: this is a descriptive tool that tells you what already happened, not a forecasting method that tells you what happens next. Treat it as context for smarter ticket-building, not a system for beating the odds.
TL;DR:
- Pair-frequency analysis provides descriptive insights based on past draws but cannot predict future outcomes, emphasizing its role in smarter ticket building.
- A typical pair's current streak within two to three times its average skip is normal variation, and only extreme deviations might warrant closer attention.
- Using both short-term and long-term data windows helps balance recent trends with overarching patterns, but mixing different pair definitions across sites can cause confusion.
- Players should diversify their picks and avoid crowded number ranges, since frequency data only guides decision-making without affecting the actual odds of winning.
- Regularly verify data freshness and pair definitions from trusted sources to prevent misinterpretation and make informed, low-risk adjustments to their ticket strategies.
Table of Contents
- What Pair Frequency Actually Measures
- How to Analyze Lottery Pairs Without Guesswork
- Reading a Pair Frequency Table Without Overreacting
- Using Pair Frequency Data Without Fooling Yourself
- How Lotto Oracle Approaches Pair Data and Data Freshness
- Why Enthusiasts Track Pair Frequency Anyway
- Where to Verify Pair-Frequency Data Yourself
- Sources
- FAQ
What Pair Frequency Actually Measures
A "pair" in this context means any two numbers that showed up together in the same drawing. Pair frequency counts how many times that specific combination has occurred across a defined stretch of draws. That count alone doesn't tell you much until you pair it with a few other metrics.
Here's the vocabulary that shows up on almost every frequency table:
- Hits: total number of times a pair has appeared together across the dataset
- Skips: the number of draws between one appearance and the next
- Current streak: how many draws it's been since the pair last hit
- Max streak: the longest gap that pair has ever gone without appearing
- Average skip: the mean gap length across the pair's entire history
Under pure random conditions, every possible pair in a given game has roughly the same theoretical chance of appearing in any single draw. In a six-number game drawn from 49 balls, there are 1,176 possible pairs, and over thousands of draws, each should settle near a similar expected hit count. Deviations happen constantly, though, because randomness produces streaks and clusters that look meaningful even when they aren't.
Statisticians check whether those deviations mean anything using three basic tools: the chi-square test compares observed pair counts against expected counts, the runs test checks whether hits and misses cluster more than chance would predict, and autocorrelation checks whether one draw's outcome has any relationship to draws before it. LotteryLAB documents endpoints for exactly these tests, which is worth knowing if you want to verify a claim instead of just trusting a website's headline number.
How to Analyze Lottery Pairs Without Guesswork
Running your own pair frequency lottery analysis starts with a decision most players skip: how much history are you actually going to look at? A window of the last 50 draws will surface very different "hot" pairs than a window covering ten years of results, and neither window is objectively correct.
Choosing your window:
- Short windows (recent 50 to 100 draws) react fast to recent runs but carry more statistical noise. A pair can look hot purely by chance in a small sample.
- Long windows (full game history, sometimes thousands of draws) smooth out that noise but can bury a genuine short-term shift in machine or ball-set behavior.
- A middle path many analysts use: run both windows side by side and flag pairs that appear unusually often in both, since that overlap is harder to explain away as pure variance.
Counting method matters just as much as window length. An unordered pair treats 7 and 23 as the same combination regardless of draw order, which is how most standard lottery draws work since balls aren't pulled in a meaningful sequence. Some tools instead track ordered or strictly consecutive pairs (like 22 and 23 appearing together), which produces a completely different count for what a casual reader would call "the same pair." Lottolyzer's published pairing tables make this distinction explicit, and it's worth checking before you compare numbers across two different sites.
For actually doing the counting, you have three realistic options: downloadable frequency tables from lottery-statistics sites, open-source scripts you run yourself for full transparency, or a basic spreadsheet where you tally co-occurrences manually from official draw archives. Whichever you pick, verify the same three things: the date range covered, whether pairs are ordered or unordered, and how recently the data was refreshed.
Reading a Pair Frequency Table Without Overreacting
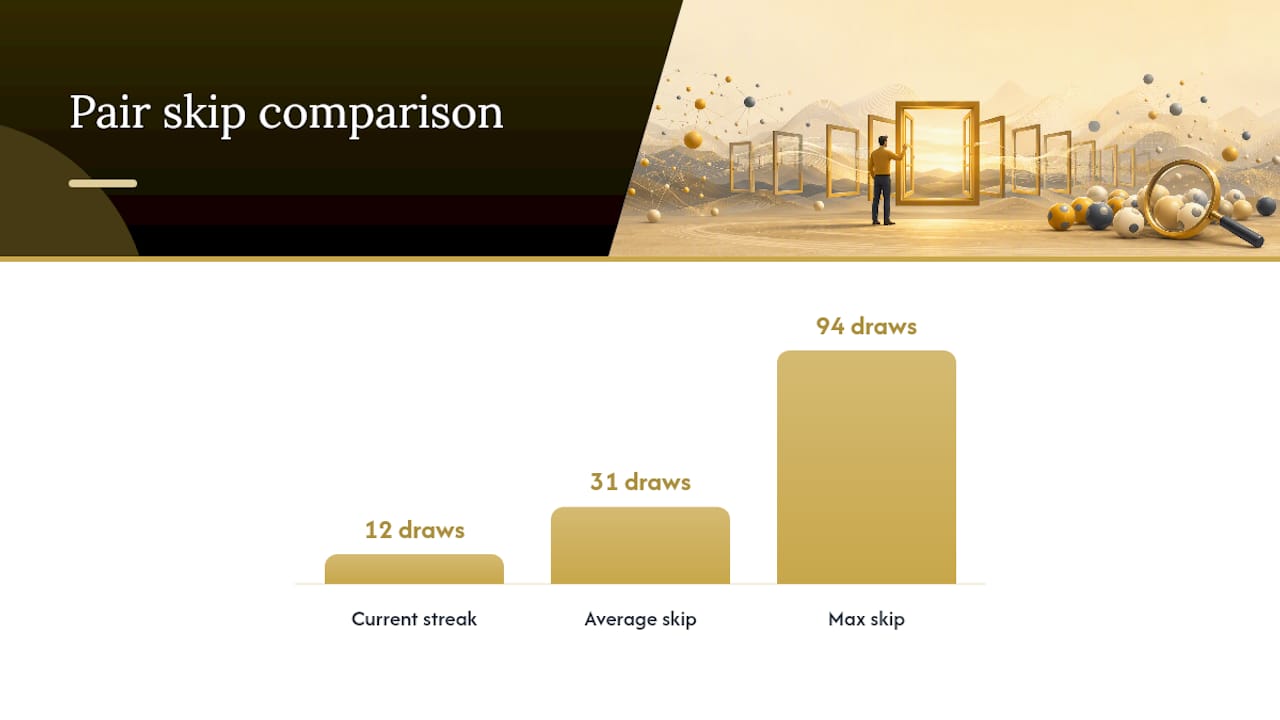
A typical pair frequency lottery table looks intimidating until you know what each column is actually telling you. Take a hypothetical row: pair 14 and 27, hits 38, average skip 31, max skip 94, current streak 12, last draw April 2, 2026. Read left to right, that row says this pair has appeared together 38 times, typically resurfaces every 31 draws or so, once went 94 draws without showing up at all, and hasn't hit in the last 12 draws.
None of that guarantees anything about draw 13. Lotteryextreme's pair statistics pages update after every drawing, which is exactly the kind of freshness check you want before trusting a table. A pair sitting at a 12 draw current streak against a 31 draw average skip isn't "overdue." It's sitting inside the normal range of variance you'd expect from any random process, and the max skip of 94 proves the gap can run three times longer without anything being wrong with the game.
A few quick heuristics help separate a real anomaly from ordinary noise:
- If the current streak is within roughly two to three times the average skip, that's typical variance, not a signal.
- A pair with an unusually low hit count relative to similar pairs over the same window deserves a second look, but check the window size first.
- Watch for round numbers or suspiciously clean patterns in the hits column. That's often a sign the tool is capping or rounding data rather than reporting raw counts.
Pro Tip: Before trusting any single row, check that the pair definition matches what you think it means. A site counting only consecutive pairs (like 5 and 6) will show wildly different numbers than one counting any two numbers drawn together, and mixing the two up is the single most common misread in lottery pair analysis.
Small sample windows and copy-paste data errors are the two most common ways a frequency table misleads a careful reader. When a number looks too extreme to be believable, it usually is.
Using Pair Frequency Data Without Fooling Yourself
Pair frequency data earns its keep as a planning tool, not a prediction engine. Used well, it helps you avoid the ticket mistakes that quietly shrink your payout even when you do win.
- Diversify your pair selections across a ticket set. Instead of chasing the single hottest pair on a table, spread your picks so you're not relying on one combination carrying the whole ticket.
- Avoid overcrowded ranges. Numbers 1 through 31 get picked constantly because of birthdates, which means a jackpot win in that range gets split more ways. Balancing your picks against common birthdate patterns reduces that split risk without touching your odds of winning at all.
- Pair complementary numbers rather than only "hot" ones. A pair that balances a frequently drawn number with a less crowded one often produces a more resilient ticket than two numbers everyone else is also playing.
Pro Tip: Set a spending limit before you look at a single frequency table, not after. Statistical context is genuinely useful for how you build a ticket, but it has no effect on your actual odds of winning, and treating it otherwise is how bankrolls disappear fast.
Pair-frequency data is descriptive context, full stop. It can shape which combinations you choose to play among equally likely options. It cannot shift the underlying probability of any one of them being drawn.
How Lotto Oracle Approaches Pair Data and Data Freshness
[brand_signal]
Historical draw data for pair-frequency work comes from official lottery draw archives, refreshed and timestamped after each new drawing so hit counts and skip values stay current rather than stale. Reliable tables always disclose that last-draw date for exactly this reason.
Some prediction apps keep two layers distinct rather than blending them into one confusing score:
- Statistical signals: hits, skips, streaks, and trend data pulled directly from historical draw records, presented as descriptive context.
- Numerology and astrology overlays: personalized insights based on birth data and zodiac timing, offered as an engaging, entertainment-based layer separate from the raw statistics.
[author_bio]
Readers deserve to know which layer they're looking at. A pair's 31-draw average skip is a math fact. A numerology-based lucky number is a different kind of insight entirely, and Lotto Oracle labels each accordingly rather than presenting one as the other.
Why Enthusiasts Track Pair Frequency Anyway
Players study pair frequency for the same reason chess players study openings: patterns are genuinely interesting, even when they don't guarantee outcomes. The realistic goal isn't finding an edge that beats the math. It's building a more thoughtful ticket and understanding your game better than someone picking numbers off a fortune cookie.
The honest ethical line is this: use frequency data to inform choices among equally likely outcomes, never to promise a win. Personally, I find statistical signals and entertainment-based overlays work best kept side by side rather than merged. One tells you what already happened. The other makes picking numbers more fun. Confusing the two is where players get into trouble.
— amsd
Where to Verify Pair-Frequency Data Yourself
For hands-on checking, three resources cover most needs: Lotteryextreme's pair tables for hits, skips, and last-draw timestamps; Lottolyzer's frequency rankings for top-pair comparisons; and LotteryLAB for open-source randomness testing. Always confirm the pair definition and refresh date before trusting any number.
Want a faster way to combine that statistical picture with personalized number guidance? Lotto Oracle tracks trend and pattern data alongside numerology and zodiac-based overlays in one subscription, so you're not juggling five browser tabs to piece together a ticket strategy.
Sources
- Powerball Number Pairs Statistics | Frequency & Skip Analysis
- Powerball - United States - Lottery Number Pairing Frequency Table
- bartoszclapinski/LotteryLAB
FAQ
Do hot pairs increase my chances of winning?
No. A pair's past hit count has no effect on its odds in the next draw, since each drawing is an independent random event regardless of recent history.
Which Canadian lottery gives players the best odds?
Odds depend entirely on the specific game's number pool and prize structure; games with smaller number fields, like Daily Grand, generally offer better jackpot odds than larger-field games like Lotto Max.
What are the top six luckiest numbers?
There's no verified set of universally "lucky" numbers. Frequency tables show which numbers or pairs have historically hit most often in a specific game's dataset, but that's a record of the past, not a guide to the future.
What are the seven luckiest numbers for Lotto Max?
No specific set of numbers holds a statistical edge in Lotto Max. Any "lucky seven" list you see reflects historical frequency in one dataset, not a predictive pattern.
Why do different sites show different frequency counts for the same pair?
Sites often use different pair definitions, counting unordered, ordered, or strictly consecutive pairs differently, which produces different totals even from the same draw history.
How often should I check a pair-frequency table?
Check freshness whenever you plan to use one, since reliable tables update after every draw and an outdated table can misrepresent current streaks and skips.