
Tracking lottery patterns works, but not the way most people hope. It exposes reliable, measurable biases in how humans pick numbers, and it can help you avoid splitting a jackpot with a thousand other people who all picked 7, 11, and their kid's birthday. What it cannot do is change the odds of any single ball dropping from the machine. Official draws stay random no matter how many spreadsheets you build.
The practical payoff is real anyway: choosing less-popular number combinations means that if you win, you're less likely to share the prize.
- Do this now: Pull the last 2 to 5 years of draw history for your game and run a basic frequency count, or let Lotto Oracle generate the trend analysis for you automatically.
Quick fact: Researchers studying over 800 million manually chosen lottery numbers found that ticket buyers consistently overload certain rows and digits on the play slip, which is the entire reason "patterns" show up in winner data at all.
Key Takeaways
Tracking lottery patterns exposes human selection bias and reduces prize splitting, but it cannot alter the fixed randomness of any official draw.
| Point | Details |
|---|---|
| Patterns come from people, not machines | The 800-million-selection study found bias in player picks, not in draw outcomes. |
| Avoid popular numbers to cut sharing | Numbers like 7 and birthdate ranges under 31 get overchosen, raising the odds of splitting a win. |
| Run four core analyses | Frequency, co-occurrence, chi-square/runs tests, and Shannon entropy each answer a different question. |
| Backtest before trusting a rule | Simulate your selection method against past draws to check for real reduction in sharing. |
| Lotto Oracle automates the process | It combines trend tracking with numerology and astrology overlays so you skip manual spreadsheet work. |
Table of Contents
- What Research Says About Selection Bias and Why Patterns Appear
- Where to Get Historical Draw Data and How to Keep It Organized
- Analyses to Run: Frequency, Co-Occurrence, Randomness, and Entropy
- Pitfalls to Avoid When Tracking Patterns
- How to Use Pattern Results to Pick Numbers Responsibly
- How Lotto Oracle Helps You Track Patterns Without the Spreadsheet Grind
- Why Tracking Lottery Patterns Gets Misunderstood
- Put Automated Pattern Tracking to Work Today
- Sources
What Research Says About Selection Bias and Why Patterns Appear
The patterns you'll find in lottery data aren't hiding in the draw machine. They're hiding in human behavior. A landmark analysis of manually selected numbers in the Israeli lottery examined more than 800 million selections and found that players gravitate toward the top rows of play slips and toward specific "lucky" digits, with the number 7 showing up disproportionately across almost every dataset examined.
That same research uncovered something less obvious: as jackpots grow, people buy more tickets, and their picks become noticeably more uniform. Each additional million in prize money generated tens of thousands of extra manual guesses, and that flood of casual buyers tends to dilute the usual clustering around popular numbers.
The draw itself is random. The pattern lives entirely in the players, not the machine, which means tracking numbers tells you about crowd behavior, not about what the next draw will produce.
This is the mechanism behind payout dilution. When a popular combination hits, more winners split the pot. Research recommends picking less-crowded numbers specifically to raise your expected value if you win, not to raise your odds of winning.
Where to Get Historical Draw Data and How to Keep It Organized
Good analysis starts with clean data, and clean data starts with knowing exactly where your numbers came from. Mixing an official feed with a scraped, unverified aggregator is how people end up "discovering" patterns that are really just data entry errors.
- Start with official lottery operator archives. These are the ground truth for date, jackpot size, and winning combination.
- Cross-check against a reputable public tracker. Sites like The Lottery Tracker publish full draw histories and frequency leaderboards, which makes a solid second source for spotting discrepancies.
- Pick a storage format and stick with it. A CSV file, a Google Sheet, or a lightweight SQLite database all work fine for a hobbyist workflow.
- Use a consistent naming convention. Something like
game_YYYYMMDD.csvkeeps years of files sortable without a headache. - Automate the pull if the game runs often. A scheduled script or an RSS feed from your source saves you from manually copying numbers every week.
Pro Tip: Before trusting any dataset, spot check ten random draws against the official operator's published results. A mismatched date or transposed number early on can quietly corrupt every calculation you run downstream.
Analyses to Run: Frequency, Co-Occurrence, Randomness, and Entropy
Four analyses cover almost everything a hobbyist needs, and each one answers a different question about your data.
- Frequency analysis. Count how often each number has appeared, sorted into "hot" and "cold" buckets. Decide your window carefully. Full-history counts smooth out short-term noise but can hide the effect of a rule change or format update from a few years back. A rolling window of the last 100 to 300 draws is often more useful for spotting recent shifts.
- Co-occurrence and pair analysis. Build a correlation matrix or heatmap showing which numbers tend to appear together. Genuine clusters are rare in a fair game, so a strong pair signal is usually a red flag for a data error rather than a real pattern.
- Randomness tests. A chi-square test compares observed frequency against the expected uniform distribution. A runs test checks whether sequences of high or low numbers appear more than chance would predict. Autocorrelation checks whether one draw's outcome relates to the next. Low p-values matter less than they sound. In a dataset with thousands of draws, tiny deviations can register as statistically significant while being practically meaningless.
- Shannon entropy. This measures unpredictability in the outcome set. Low entropy in draw results would suggest something is off with the machine or process. Low entropy in player selections just confirms what the 800-million-selection study already found: people aren't picking randomly, even when the numbers are.
| Analysis | What it reveals | Watch for |
|---|---|---|
| Frequency count | Hot/cold numbers over your chosen window | Window too short or too long skews results |
| Co-occurrence matrix | Pairs or clusters appearing together | Strong pairs often signal a data error |
| Chi-square / runs test | Whether draws deviate from uniform randomness | Large samples can flag trivial deviations |
| Shannon entropy | Overall unpredictability of a dataset | Low entropy in picks reflects players, not draws |
Open-source projects like LotteryLAB implement all four of these out of the box, including correlation heatmaps and entropy scoring, which saves you from building the math from scratch.
Pitfalls to Avoid When Tracking Patterns
Pattern tracking goes wrong in a handful of predictable ways, and most of them come from misreading noise as signal.
- Gambler's fallacy. A number "overdue" after 40 draws is no more likely to appear next time. Each draw is independent, full stop.
- Chasing short streaks. A number hitting three times in five draws feels meaningful but usually falls apart under a basic significance test.
- Copying culturally popular picks. Birthdates cap out at 31, so numbers 32 and above get chosen far less often. Riding the birthdate wave into a win means splitting it more ways, as detailed in this breakdown of birthdate-driven number clustering.
- Ignoring jackpot size. Bigger jackpots draw in casual players whose picks skew the crowd toward uniformity, which shifts which numbers count as "popular" that week.
How to Use Pattern Results to Pick Numbers Responsibly
Turning analysis into a selection strategy comes down to a few concrete rules, then testing whether those rules actually help.
- Skip the top-row hotspots. If your frequency data shows heavy clustering in low numbers or slip-corner positions, deliberately weight your picks toward less-crowded sections of the number field.
- Mix in genuinely random picks. A quick pick alongside your analyzed numbers keeps your overall approach diversified rather than betting everything on one theory.
- Spread across number groups. Avoid loading an entire ticket with numbers under 31, since that range absorbs most birthdate-based picks.
- Backtest before you commit. Simulate your selection rule against several years of past draws and track how often it would have hit and how many hypothetical winners it would have split with. This kind of retrospective test is standard practice among hobbyist analysts and gives you a rough read on whether your method reduces sharing.
- Know when to automate. A manual spreadsheet works fine for basic frequency counts, but pair correlations and entropy scoring get tedious fast by hand. That's where an app pulls ahead.
Pro Tip: Run your backtest across at least two different "eras" of the game's history separately. Format changes and rule updates can quietly distort a full-history average into something that never actually existed in either period.
How Lotto Oracle Helps You Track Patterns Without the Spreadsheet Grind
Manual tracking teaches you the mechanics, but most players eventually want the pattern-detection without the weekend spent debugging a pivot table. Lotto Oracle automates the core workflow described above and layers in personalization on top of it.
- Trend and pattern tracking that updates as new draws post, so you're not manually re-running frequency counts.
- History filters that let you view different eras or windows without rebuilding your dataset.
- Personalized overlays using numerology and astrology alongside the statistical analysis, for players who want both angles in one place.
- Daily insight generation, replacing a manual weekly review with an ongoing feed.
For readers who want the math explained further, the frequency guide for Lotto 6/49 and the probability basics primer both walk through the underlying concepts in more depth.
Why Tracking Lottery Patterns Gets Misunderstood
The conventional advice online treats pattern tracking as a prediction engine, and that's where most guides go wrong. The 800-million-selection research doesn't support prediction at all. It supports something narrower and more useful: understanding what other players are doing so you don't end up splitting a jackpot six ways with people who all picked the same birthdate combo.
Where most articles overstate the case, the honest version is this: chi-square tests and entropy scores are diagnostic instruments, not crystal balls. They tell you whether a dataset deviates from uniform randomness, not whether a particular number is "due." Treating a low p-value as a prediction signal is the single most common misuse of this kind of analysis I've seen repeated across amateur forums.
What should come first, ahead of any fancy statistical test, is the boring part: get clean data, verify it against a second source, and understand that every rule you build has to survive a backtest before you trust it with real money. Skip that step and the rest of the analysis is decoration.
— amsd
Put Automated Pattern Tracking to Work Today
Building your own frequency spreadsheet and running chi-square tests by hand teaches you the fundamentals, but it eats a weekend every time you want fresh numbers. Lotto Oracle does that tracking automatically, refreshing trend and pattern data as new draws post instead of waiting on your next manual pull.
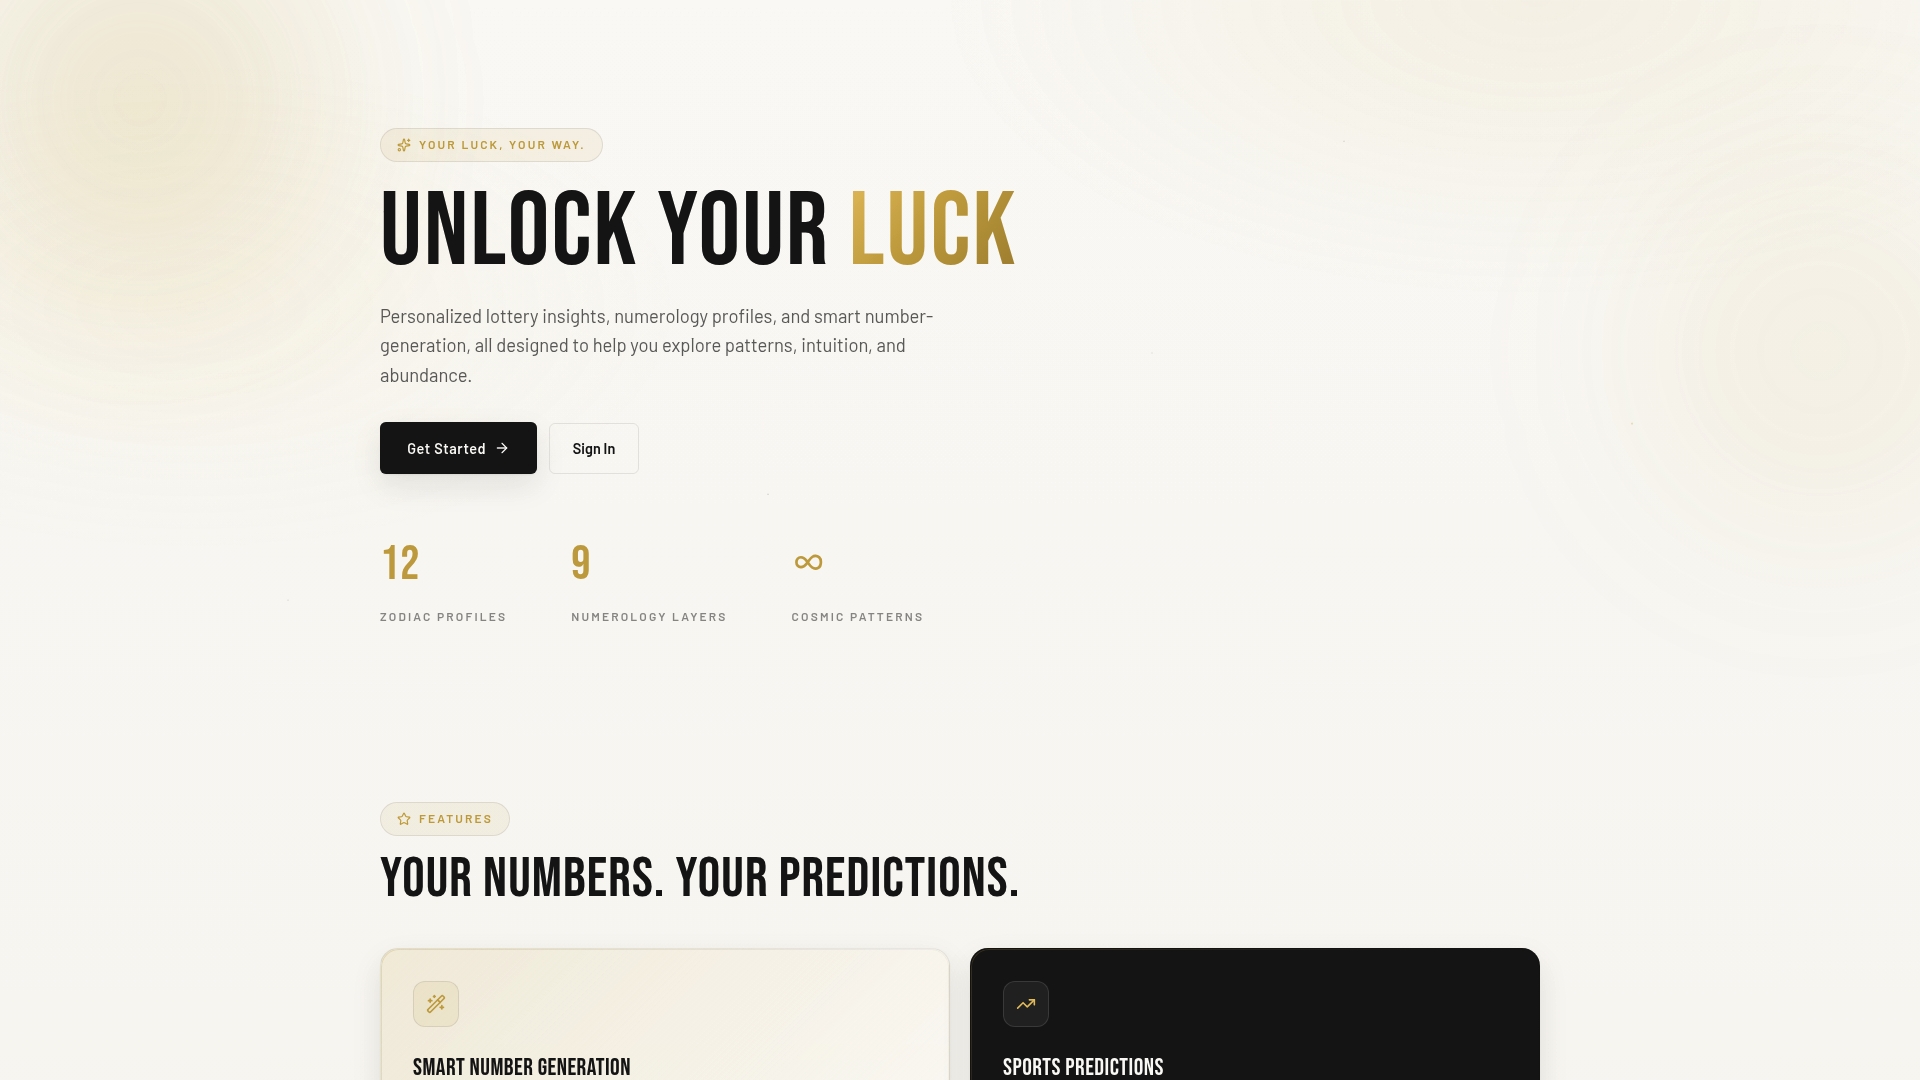
What sets it apart for readers coming from this kind of analysis is the personalization layer. Beyond raw frequency and pair correlation, Lotto Oracle folds in numerology and astrology overlays so your picks reflect both the statistical picture and a personal angle, all inside one subscription instead of juggling a spreadsheet and a separate app. If you've been tracking numbers manually and want the pattern detection without the maintenance, check your personalized number insights and see what the current trend data shows for your next draw.
Sources
- LotteryLAB (GitHub) — lottery analysis application
- The Lottery Tracker — draw histories and statistics