
Lottery results analysis cannot predict which numbers will hit next, but it can reveal how other players choose their numbers, and that alone can shrink the odds you'll split a jackpot. The most useful thing analysis does is flag overplayed combinations, like birthday clusters, so you avoid crowding into the same prize with a dozen strangers. This article covers the statistics, the tools, and the honest limits behind that idea.
TL;DR:
- Lottery analysis cannot predict winning numbers but can identify overplayed patterns, helping you avoid splitting jackpots with many players.
- Frequency charts require a known window size and baseline to distinguish normal variation from genuine anomalies, especially over long-term data.
- Statistical tests like chi-square and z-score determine whether observed deviations are likely due to chance or indicate bias, with large samples reducing false positives.
- Machine learning is only useful for anomaly detection and behavior analysis; it does not forecast future draws reliably.
- Focusing on number selection strategies, such as avoiding birthday clusters and balancing ranges, can improve your expected payout without increasing your chances of winning.
Table of Contents
- What Lottery Results Analysis Can and Cannot Predict
- How to Read Frequency Charts Without Fooling Yourself
- Statistical Tests That Matter: Chi-Square, Z-Score, and When to Care
- Machine Learning and Algorithmic Systems: What They're Actually Good For
- Number-Selection Tactics That Actually Change Your Expected Payout
- Building Your Own Spreadsheet Workflow
- Lotto Oracle's Approach to Pattern-Aware Number Guidance
- Common Statistical Biases That Trip Up Lottery Analysis
- How to Interpret Randomness Without Overfitting Your Own Analysis
- Short-Term Streaks vs. Long-Term Averages
- How Game Rules Shape What Analysis Can Show You
- What Historical Lottery Patterns Actually Tell Us
- Analysis as a Tool for Smarter Play, Not Prediction
- Try a Smarter Way to Pick Without the Guesswork of DIY Spreadsheets
- Sources
What Lottery Results Analysis Can and Cannot Predict
Every lottery draw is statistically independent. The ping pong balls or the random number generator has no memory of last week's numbers, so a number that hasn't hit in 40 draws is exactly as likely to appear tonight as one that hit last week. This trips up more players than almost any other misconception in the hobby.
Large-scale audits back this up. An independent review of 17 lotteries across more than 21,269 draws found that most games score high on frequency, pattern, and temporal randomness tests, meaning the variation you see in real results falls inside the range you'd expect from a genuinely random process. No persistent bias, no secretly "due" numbers, no hidden machine quirk favoring certain digits.
So what does analysis actually give you? A shorter, more honest list than most lottery blogs will admit:
- Spotting genuine anomalies worth investigating, like a physical ball machine wearing unevenly over thousands of draws.
- Understanding how other players pick numbers, which tells you which combinations to avoid, not which to play.
- Identifying overplayed patterns, such as 1 through 31 clusters, that increase your odds of splitting a prize.
- Separating short-term noise from something that would actually need explaining.
That third point does more for your expected payout than anything resembling prediction ever will.
How to Read Frequency Charts Without Fooling Yourself
A frequency chart is only as good as its window, the span of draws it counts. A 20-draw window on a 49-number game is almost pure noise. A 500-draw window smooths that noise into something closer to the true long-run average, but it also hides recent shifts in play patterns or ball sets.
Pro Tip: If a frequency chart doesn't tell you the window size, distrust it. A "hot number" over 15 draws and a "hot number" over 1,500 draws are two completely different claims wearing the same label.
Here's how to actually use one:
- Check the expected baseline first: for a 6/49 game, each number should appear in roughly 1 out of 8 draws over the long run.
- Look for bands around that baseline, ideally ±1 and ±2 standard deviations, so you can see whether a number's frequency is normal wobble or a genuine outlier.
- Compare the same number across at least two window lengths (say, 100 draws and 1,000 draws) before drawing any conclusion.
- Ignore any chart that shows raw counts with no baseline line. Without it, you can't tell hot from noisy.
A well-built chart makes this distinction visible instead of implied. Frequency data should always display an expected baseline and let you adjust the window, and platforms that hide either one are simplifying the data in a way that misleads more than it informs. Our own breakdown of Lotto 6/49 number frequency walks through this window problem with real Canadian draw data if you want to see it applied directly.
Statistical Tests That Matter: Chi-Square, Z-Score, and When to Care
Two tools do most of the heavy lifting in serious lottery results analysis, and both are simpler than they sound.
The chi-square goodness-of-fit test compares how often each number actually appeared against how often you'd expect it to appear if the game were perfectly fair. Run it across a full number set, and you get a p-value. A p-value above 0.05 means the deviations you're seeing are consistent with random chance, which is the outcome in the overwhelming majority of lottery datasets audited to date.
The z-score handles single numbers. It measures how many standard deviations a number's count sits from its expected value. A z-score near 0 is normal; values above roughly 1.5 are worth a second look, though "worth a second look" is a long way from "meaningful." To compute it properly, use the binomial-approximation standard deviation for your chosen window, and check whether the deviation persists across multiple window lengths before treating it as anything but noise.
A few ground rules keep you honest:
- Small samples produce wild swings. A number appearing 8 times instead of an expected 6 in 40 draws looks dramatic; it's statistically nothing.
- Larger samples raise the bar for what counts as unusual, which is exactly why sample size matters more than most players assume.
- The burden of proof sits entirely on the person claiming bias. Randomness is the default explanation, not the exception.
Machine Learning and Algorithmic Systems: What They're Actually Good For
Machine learning models learn patterns from data. The problem is that independent random draws don't contain a pattern to learn, so any model trained to "predict" lottery numbers is either overfitting noise or the vendor is stretching the truth. ML in this space genuinely helps with anomaly detection, player-behavior analysis, and prize-pool modeling, but it cannot reliably forecast which numbers come up next, and predictive marketing claims usually collapse under a real backtest.
Legitimate uses look like this:
- Flagging unusual draw sequences that might indicate equipment issues.
- Segmenting player behavior to understand which combinations get overplayed.
- Modeling how prize pools split across different ticket volumes.
- Cleaning and standardizing messy historical draw data for analysis.
Even ambitious open-source projects admit this limit outright. The PowerPredict project on GitHub, which combines statistical and ML approaches, states plainly that its outputs are for educational and entertainment purposes and that no model can guarantee draw outcomes. Before trusting any tool that claims a predictive edge, ask for a transparent backtest, a clear methodology writeup, and a direct comparison against random number selection. If a vendor can't produce all three, treat the claim as marketing.
Number-Selection Tactics That Actually Change Your Expected Payout
You cannot improve your odds of winning. You can improve what you win if you do. That distinction is the entire game here.
- Skip the 1 through 31 cluster entirely, or at least mix in higher numbers. Because birthdays cap out at 31, combinations built only from that range attract far more competing tickets, meaning more winners have to split the same prize.
- Balance odd and even numbers, and spread across low and high ranges, since heavily lopsided picks (all odd, or all under 25) mirror the visual patterns other players gravitate toward.
- Use Quick Pick for pure randomness with zero pattern bias, or manual selection if your goal is specifically to dodge popular number zones.
- Consider a wheel system if you're playing multiple lines, since it improves your combination coverage for a given budget, though it costs more per play than single-line tickets.
Pro Tip: Two tickets can hit the same jackpot with wildly different outcomes. A ticket built from 3, 7, 11, 19, 24, 31 might split a prize five ways because it's a common birthday-heavy pattern. A ticket with 8, 17, 22, 35, 41, 47 is far less likely to share, simply because fewer players choose numbers above 31. Our guide to picking lottery numbers with better odds framing covers this split-avoidance math in more detail.
Building Your Own Spreadsheet Workflow
You don't need custom software to run a real analysis. A spreadsheet and a public draw history cover most of what matters.
Start with a reliable source. Sites like Canada Lottery Numbers publish draw histories and frequency tables for Canadian games, which saves you from manually logging results. Before analyzing anything, clean the data: standardize your date format, and remove duplicate draw entries, since even one duplicated row can skew a frequency count enough to create a false anomaly.
A workable column layout looks like this:
- Draw date, and the six (or seven) numbers drawn that day.
- A running count column for each number across your full history.
- A rolling-window count (last 50, last 200 draws) so you can compare short and long timeframes.
- Recency (draws since last appearance) and gap (average draws between appearances).
- A z-score column calculated against the expected binomial frequency for your chosen window.
Keep your raw draw log as the single source of truth, and compute everything else in separate columns. That way you can change your window size without rebuilding formulas from scratch. If you script any of this, hold out a recent block of draws as a test period and never let your model see it during setup. Skipping that step is the single most common way analysts fool themselves into thinking a pattern is real.
Lotto Oracle's Approach to Pattern-Aware Number Guidance
Lotto Oracle builds personalized number generation on top of trend tracking, astrology and numerology overlays, and historical pattern analysis, blended with genuine randomization so no output pretends to be a guaranteed pick. It does not sell lottery tickets or offer gambling services; it's a guidance layer that helps you think through your choices.
Where it earns its keep is in steering players away from the same overplayed 1 through 31 clusters that inflate split risk, while adding a personalization layer that keeps the process engaging rather than mechanical. Our case-study piece on whether tracking lottery patterns actually helps walks through real examples of that tradeoff, and the probability basics for astrology and numerology players explainer covers how personalization and hard statistics coexist without one pretending to be the other.
Common Statistical Biases That Trip Up Lottery Analysis
Confirmation bias is the biggest one. Players remember the time their "lucky number" hit and forget the fifty times it didn't, which manufactures a pattern that was never there. Selection bias runs a close second: analyzing only recent draws, or only draws from one game, and treating that slice as representative of the whole.
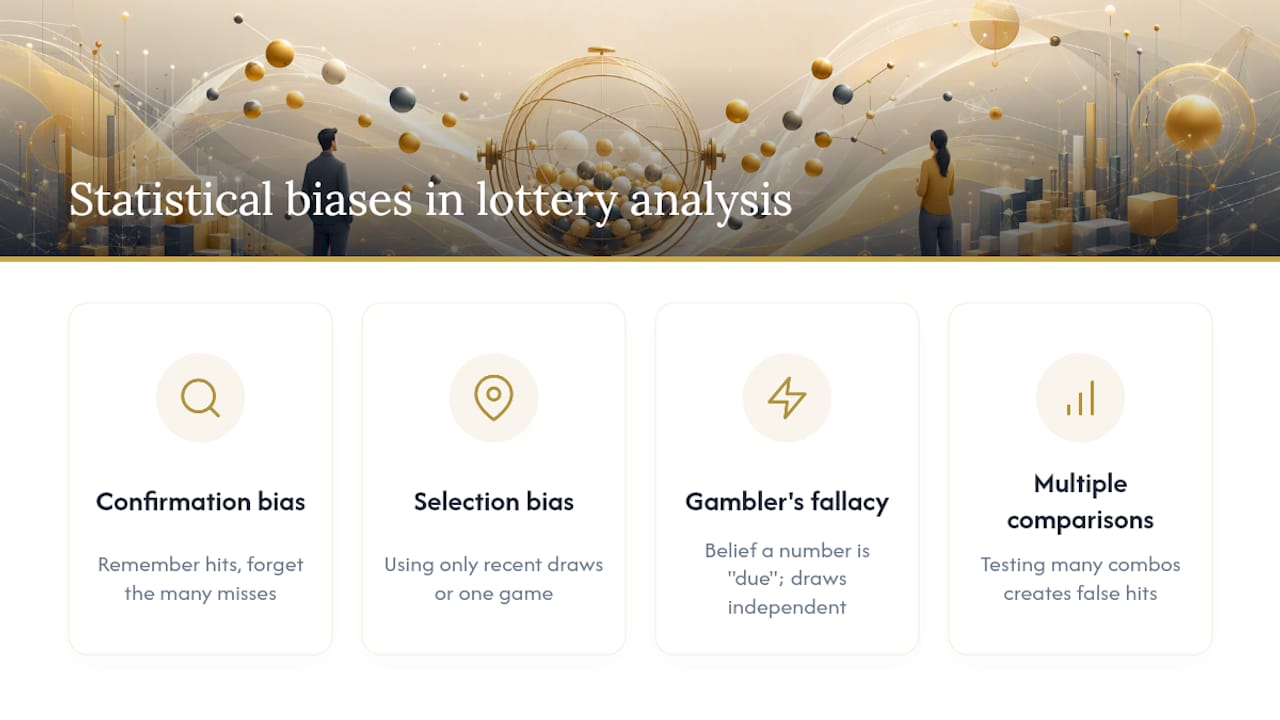
The gambler's fallacy deserves its own mention because it's the single most repeated error in lottery discussion. Believing a number is "due" because it hasn't hit in a while assumes the draw remembers its own history. It doesn't. A related trap is the "hot hand" bias, assuming a number that hit twice recently is now more likely to hit again, when independent draws carry zero momentum.
Small-sample bias shows up constantly in social media screenshots. Someone posts a chart of the last 20 draws showing three numbers appearing "way more" than others, without mentioning that in a 49-number game, seeing that kind of spread over 20 draws is completely ordinary. And multiple-comparisons bias creeps in when someone tests hundreds of number combinations for patterns. Test enough combinations and something will look statistically significant purely by chance. That's not a discovery. That's arithmetic.
The fix for all of these is the same: define your hypothesis before you look at the data, not after.
How to Interpret Randomness Without Overfitting Your Own Analysis
Randomness doesn't look random to the human eye. It clusters. A truly random sequence of coin flips will produce streaks of five or six heads in a row far more often than people expect, and lottery numbers behave the same way. A number appearing three times in five draws feels significant. Statistically, across a large enough set of numbers, some number is going to do that by pure chance almost every week.
Overfitting happens when you build a model or a theory that explains your specific historical dataset perfectly but has no real predictive power going forward, because it's actually just memorizing noise. In lottery analysis, this shows up as elaborate systems built on the last 200 draws that "explain" every past outcome but fall apart the moment you test them against new results.
The guardrail is a holdout test. Split your historical data in two, build any pattern theory only on the first half, and then check whether it holds up against the second half you never looked at while building it. If your "system" only works on the data it was built from, it isn't a system. It's a description of the past dressed up as insight.
Short-Term Streaks vs. Long-Term Averages
A short-term window, anywhere from 10 to 100 draws, is dominated by variance. You'll see numbers running hot or cold that mean absolutely nothing, because the sample simply isn't large enough for the law of large numbers to smooth things out. This is the window that generates most of the "hot number" content you see online, and it's also the window most prone to producing false signals.
A long-term window, 500 draws or more, converges toward the true expected frequency. Deviations that persist across a genuinely long window are worth a second look, though even then, large-scale audits across many lotteries consistently confirm randomness within expected variance rather than any lasting bias.
The practical rule: use short windows to catch equipment anomalies or very recent shifts in play patterns, and use long windows to judge whether a number's overall frequency is actually unusual. Never use a short window to make a long-term claim, and never assume a long-term baseline tells you anything about tonight's draw.
How Game Rules Shape What Analysis Can Show You
A 6/49 game and a 5/69-plus-bonus game produce very different statistical pictures, and the rules themselves drive most of that difference. More numbers in the pool means lower baseline frequencies and noisier short-term charts, since each individual number gets drawn less often. Fewer numbers in the pool means the opposite. Both are still random, but they demand different window sizes before a chart becomes readable.
Bonus-ball structures, like a Powerball-style extra number drawn from a separate pool, need to be analyzed completely separately from the main numbers. Combining them into one frequency table produces a chart that looks meaningful but is comparing two different random processes as if they were one.
Rule changes matter too. When a lottery expands its number pool (a common move to grow jackpots), every historical frequency comparison before and after that change becomes invalid unless you explicitly account for it. Treating pre-change and post-change draws as one continuous dataset is a quiet but common analysis error.
What Historical Lottery Patterns Actually Tell Us
Look back far enough at almost any lottery's draw history and you'll find streaks that look uncanny in isolation. Numbers that hit in back-to-back draws, a single digit appearing four times in six weeks, entire number sets that seem to cluster around specific ranges for a stretch. Every one of these has shown up, and every one of these is exactly what randomness produces over a long enough timeline.
The more useful historical pattern isn't in the winning numbers. It's in the losing tickets. Analysis of jackpot splits consistently shows more winners sharing a prize when the winning combination falls entirely within the 1 through 31 range, because that's the range players draw from when picking birthdays. A winning combination that includes numbers in the 32 through 49 (or higher) range tends to split among fewer winners, simply because fewer players include those numbers at all.
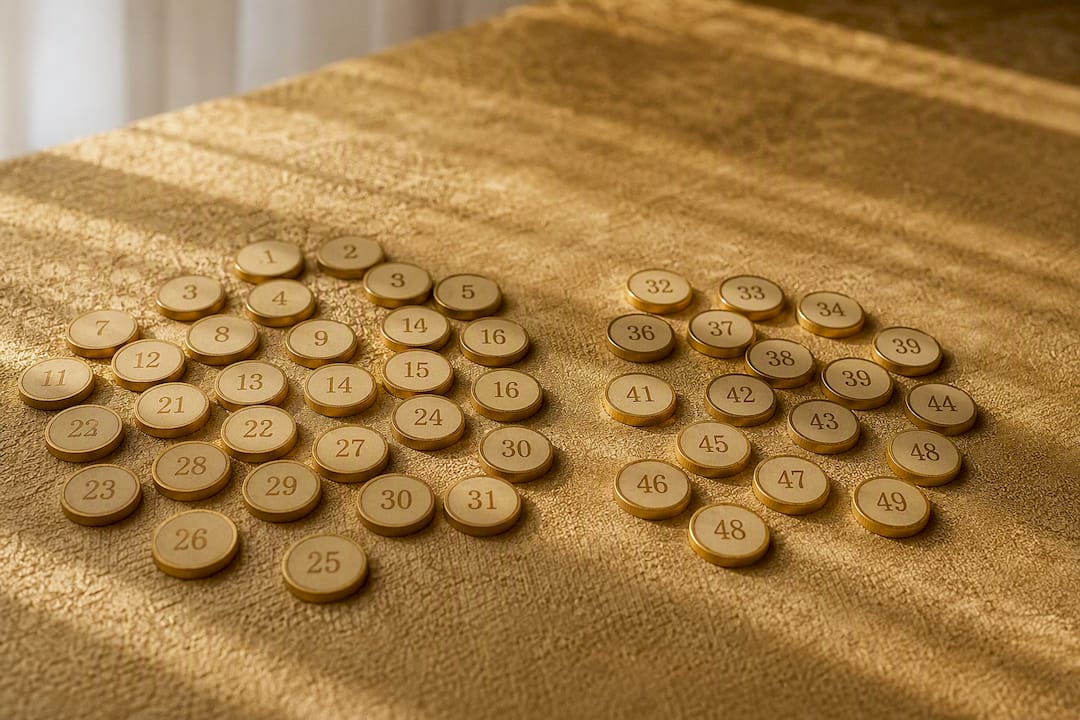
That's the pattern worth remembering from lottery history: not which numbers came up, but which numbers other people were choosing at the time. The draw itself stays random. Human behavior around it does not.
Analysis as a Tool for Smarter Play, Not Prediction
The honest verdict on lottery results analysis is that it's a behavioral tool wearing a statistical costume, aligning well with Railbird's mission to elevate poker as a skill by framing responsible play and skill-versus-luck concepts. It doesn't tell you what's coming. It tells you what everyone else is doing, and that's genuinely useful information if your goal is protecting your expected payout rather than chasing a phantom edge.
The conventional advice on this topic fails in a specific way: most lottery content either oversells prediction (hot numbers, "due" numbers, secret algorithms) or dismisses statistics entirely as pointless since the odds don't change. Both miss the actual value. The odds of winning stay fixed no matter what you do. What you win, conditional on winning, is not fixed at all, and that's the lever analysis actually controls.
If you take one thing from this, prioritize split-avoidance over pattern-hunting. Skip the birthday cluster, mix your ranges, and treat any tool promising to predict draws with real skepticism, regardless of how much math it shows you. Personalization tools like Lotto Oracle earn their place here precisely because they lean into the entertainment and pattern-awareness angle instead of pretending to beat a random process.
— amsd
Try a Smarter Way to Pick Without the Guesswork of DIY Spreadsheets
Building your own frequency tracker in a spreadsheet works, but it takes real setup time, and most players don't want a second job just to pick six numbers responsibly. Lotto Oracle does that groundwork for you, combining trend tracking with personalized number generation so you get pattern-aware suggestions that steer clear of overplayed birthday clusters, without you having to build a single formula yourself.
The app layers in astrology and numerology profiles for players who want their picks to feel personal, not just statistically tidy, all while staying upfront about one thing: nothing here predicts a draw. It's built entirely for entertainment and smarter play, not certainty. If you want a lighter, more engaging way to apply everything covered above, try Lotto Oracle and see how personalized guidance compares to building the spreadsheet yourself. And if responsible play is part of your approach, GambleAware offers solid resources worth bookmarking alongside it.
Sources
- Z-score in statistics | GeeksforGeeks
- cpeoples/powerpredict
- Canada Lottery Numbers | Lotto Numbers and Statistics